It’s 4:45 PM on a Friday. Your team’s core web application just started throwing intermittent 500 errors during checkout, and the support tickets are piling up. You crack open your browser's Developer Tools, navigate to the Network tab, and hit refresh. Instantly, you're hit with a chaotic waterfall of 400 simultaneous requests—auth tokens, third-party trackers, fonts, and microservice calls—all hopelessly tangled together. Somewhere in that mess is the single failing API call you need to fix before you can go home.
How do you find the needle in this digital haystack without losing your mind? You need a way to freeze that chaos, untangle the threads, and visualize exactly what happened. This is where HAR files and sequence diagrams become your most valuable debugging tools.
A Primer on the HTTP Archive (.har) Format
A HAR (HTTP Archive) file is a standardized, JSON-formatted log of a web browser's interactions with a site. It records comprehensive details about every single request and response that occurs during a browsing session, including headers, cookies, query parameters, payloads, and precise timing metrics.
Because it captures the raw data of a session, a HAR file is structured as a deeply nested JSON object. Here is a simplified representation of its structure:
{
  "log": {
    "version": "1.2",
    "creator": { "name": "WebInspector" },
    "entries": [
      {
        "startedDateTime": "2026-03-07T10:00:00Z",
        "request": {
          "method": "POST",
          "url": "[https://api.yoursite.com/login](https://api.yoursite.com/login)",
          "headers": [ ... ]
        },
        "response": {
          "status": 500,
          "content": { "text": "Internal Server Error" }
        },
        "time": 450.5
      },
      ...
    ]
  }
}
How to Collect a HAR File
Generating a HAR file requires no external software or plugins; it can be done directly from any modern web browser.
-
Open your browser's Developer Tools (usually by pressing
F12orCtrl+Shift+I/Cmd+Option+I). -
Navigate to the Network tab.
-
Ensure the recording button is active (usually a red circle) and perform the action on the webpage that you wish to record (e.g., submitting a form or loading a specific page).
-
Once the network activity has concluded, right-click anywhere inside the waterfall list of requests.
-
Select "Save all as HAR with content" (or the equivalent phrasing in your specific browser).
This will download a .har file to your local machine, ready for analysis.
The Challenge of Visualizing Large HAR Files
The most effective way to understand chronological network interactions is through a sequence diagram. However, rendering a HAR file into a sequence diagram presents a significant technical challenge due to the sheer volume of data.
Standard text-to-diagram tools like PlantUML and Mermaid.js are excellent for manually charting system architectures where diagrams typically consist of 20 to 50 nodes. However, an automated HAR file capture from a modern web application can easily contain thousands of entries.
When attempting to process this volume of data, traditional layout engines often fail. The calculations required to route intersecting lines and lifelines for thousands of asynchronous events can lead to browser unresponsiveness, out-of-memory errors, or complete rendering failures.
Native HAR Support in WebSequenceDiagrams
To bridge this gap, WebSequenceDiagrams (WSD) has introduced native support specifically engineered for HAR files. Rather than relying on standard text-parsing layout engines, WSD utilizes a highly optimized rendering engine designed to handle the scale and complexity of automated browser logs.
Steps for Importing and Analyzing
1. Importing the File You can import your network log by navigating to websequencediagrams.com and selecting "Open HAR file" from the File menu.
2. Automatic Parsing and Rendering WSD bypasses the performance limitations of standard tools by instantly parsing the JSON data and generating the diagram. The engine is built to scale, ensuring that even large HAR files with thousands of requests render smoothly without crashing the browser tab.
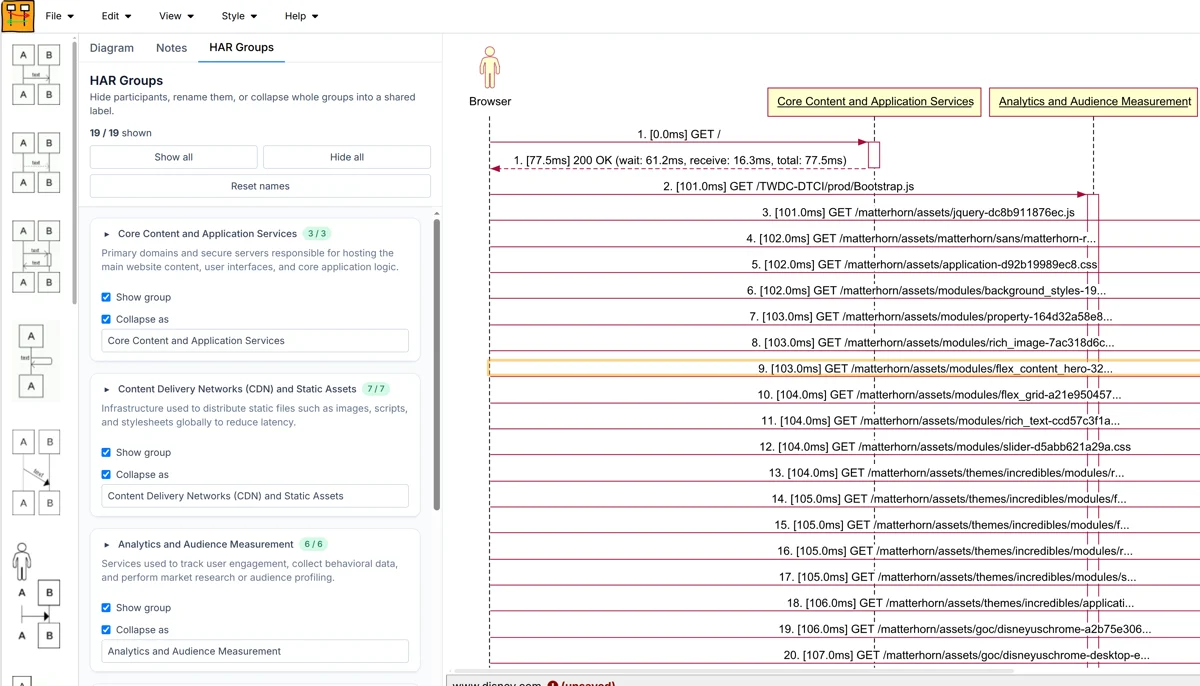
3. Grouping and Filtering Servers The core advantage of using WSD for HAR analysis is its intelligent categorization. Instead of plotting thousands of separate, unreadable lifelines, WSD automatically analyzes the data and groups servers into distinct categories based on their domains.
Through the user interface, developers can selectively combine or remove these servers to isolate the specific problem area:
-
Consolidating Noise: You can group numerous requests to analytics domains (e.g.,
google-analytics.com,facebook.com) into a single lifeline labeled "Trackers." -
Filtering Static Assets: Dozens of requests for images,
.js, and.cssfiles from CDNs can be grouped into a "Static Assets" bucket or hidden entirely. -
Focusing on Core Logic: By filtering out the extraneous third-party requests, you can narrow down the visualization to only the core interactions between your front-end client, your API gateway, and your authentication services.
Conclusion
Analyzing network logs doesn't require manually sifting through thousands of lines of JSON or relying on expensive performance monitoring dashboards. By leveraging the native HAR support in WebSequenceDiagrams, developers can quickly transform dense network captures into clean, readable sequence diagrams. The ability to automatically group domains and filter out irrelevant requests makes it an essential tool for rapidly diagnosing and resolving web application issues.

Comments